Analyze Disk Usage in Mac
As a developer reported the OpenAI Codex bug could potentially destroy your SSD in a year, I took a look at the disk usage in the Activity Monitor. Surprise surprise, the app with most IOPS was, Linear; followed by Antigravity.
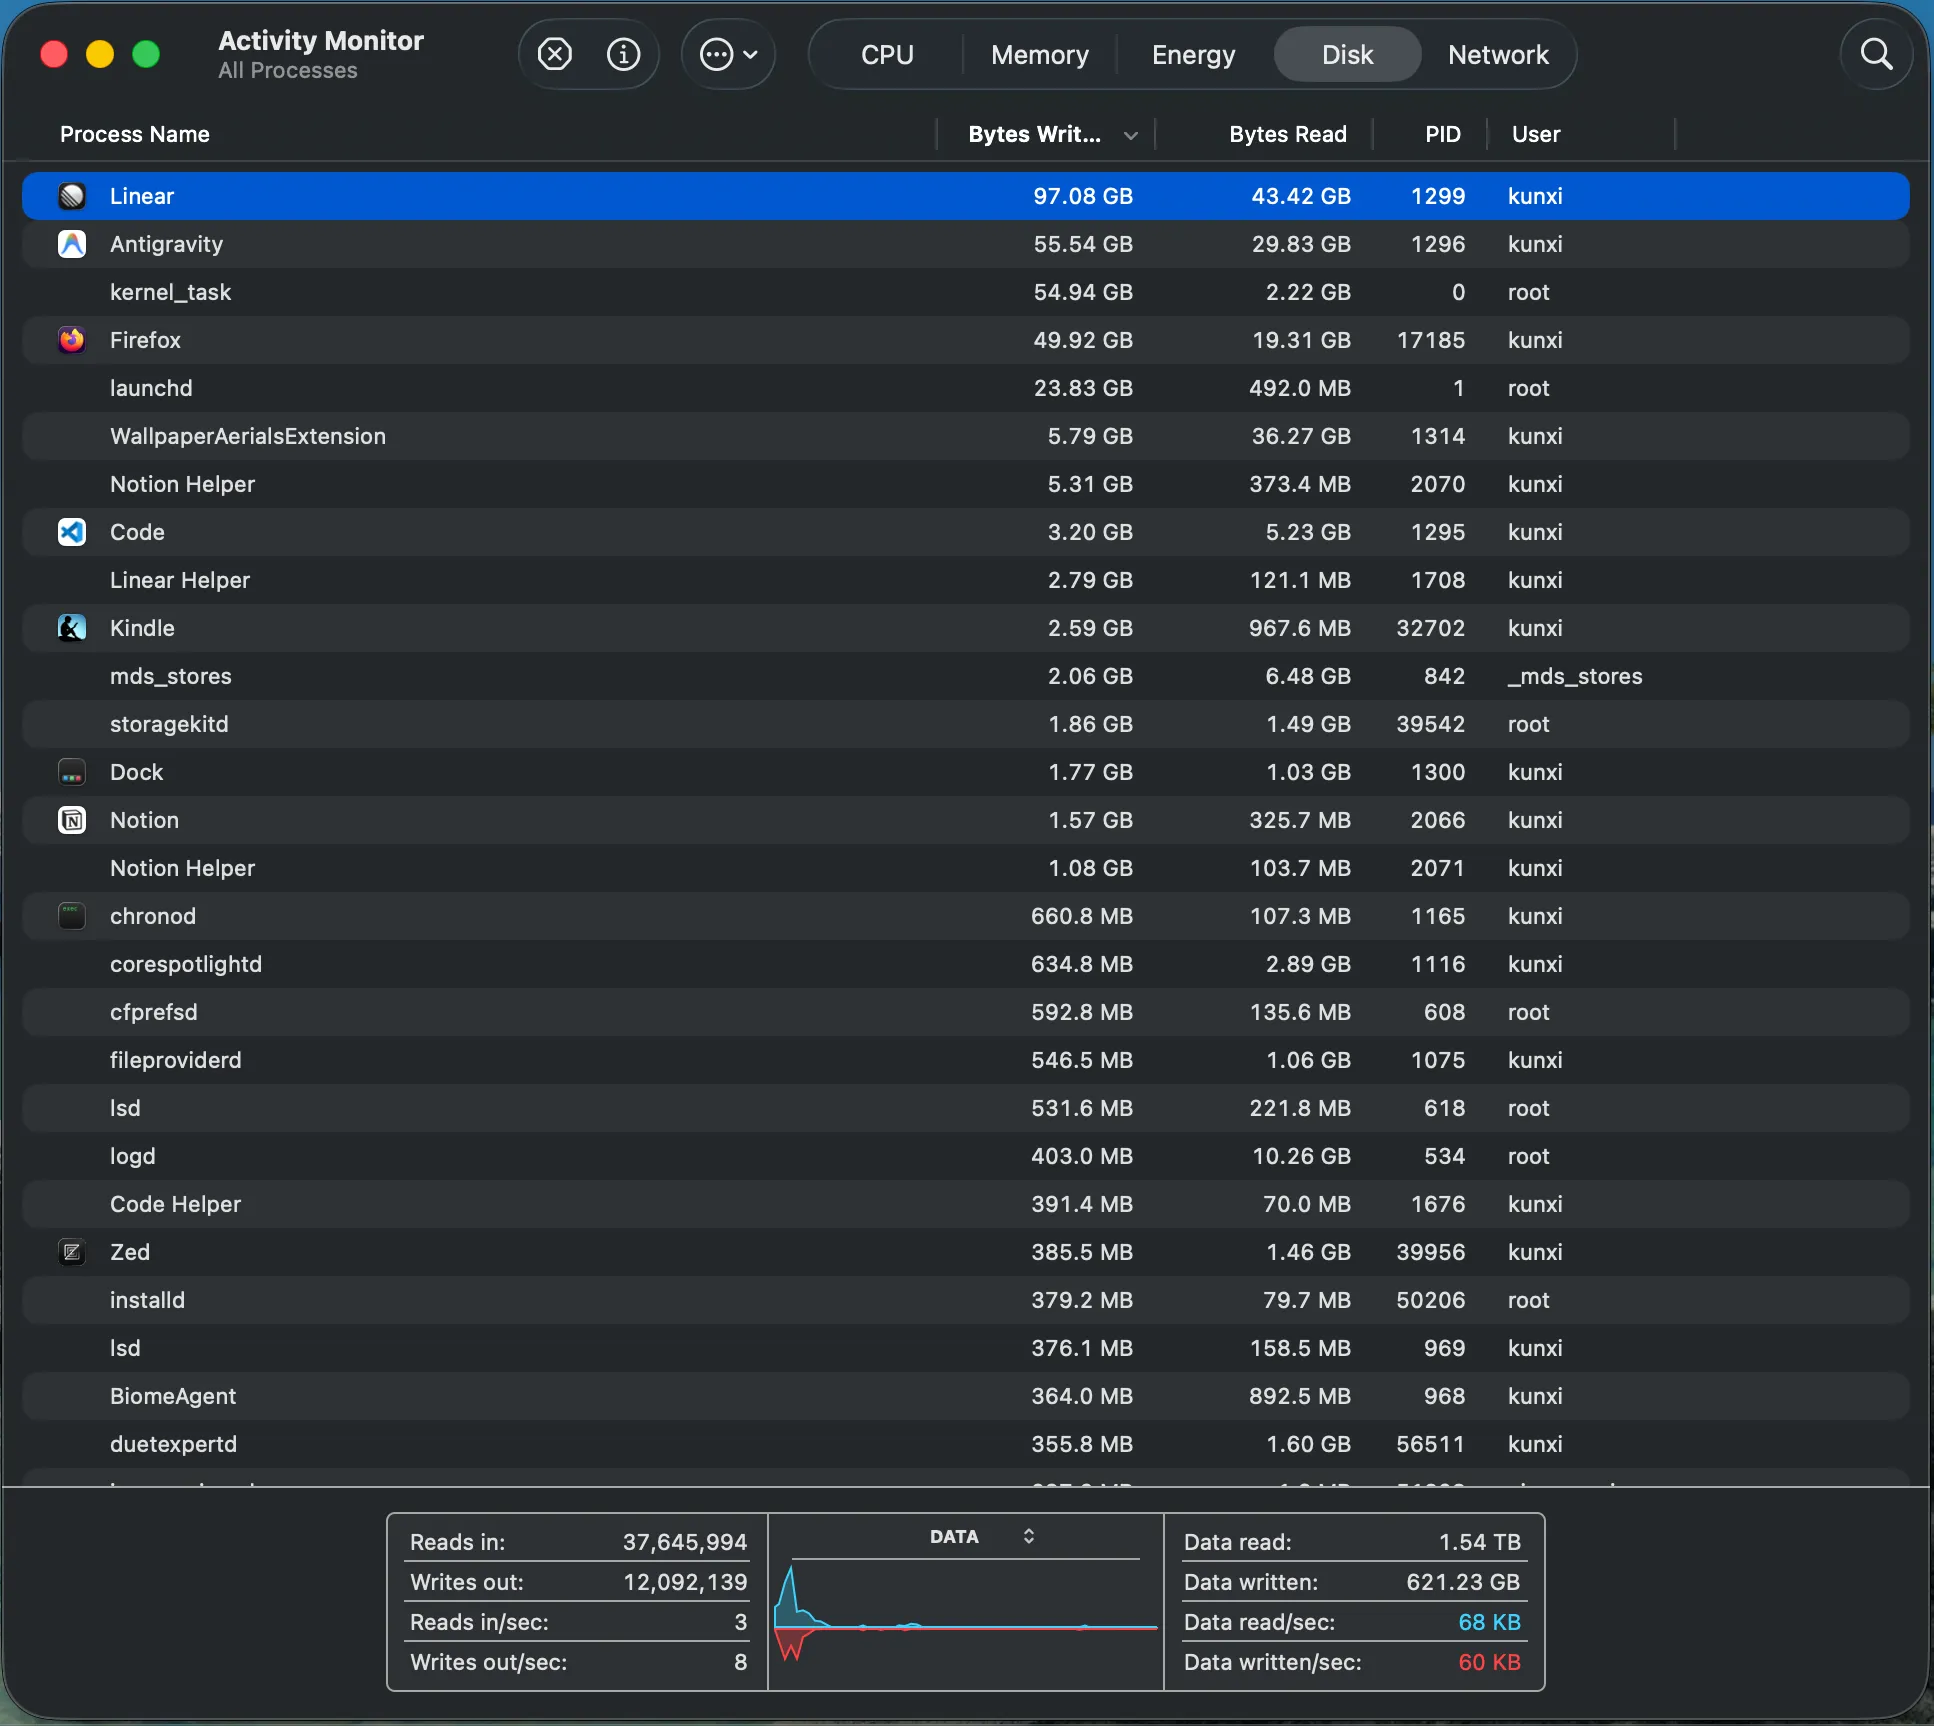
With fs_usage -f pathname 1299, we can peek into the the file access pattern of a process in real-time.
sudo fs_usage  -f pathname 1299`

21:44:43.798680  stat64                                 /Users/kunxi/Library/Application Support/Linear/Session Storage/000482.ldb           0.000002   Linear.13039
21:44:43.798681  stat64                                 /Users/kunxi/Library/Application Support/Linear/Session Storage/000480.ldb           0.000002   Linear.13039
21:44:43.798682  close             F=73                                                                                                      0.000001   Linear.13039
21:44:43.798737  fstatat64                              [-2]//Users/kunxi/Library/Application Support/Linear/Session Storage/000478.log      0.000003   Linear.13039
21:44:43.799623  unlinkat                               [-2]//Users/kunxi/Library/Application Support/Linear/Session Storage/000478.log      0.000886   Linear.13039
21:44:50.345455  mkdir                  [ 17]           /Users/kunxi/Library/Application Support/Linear/sentry                               0.000109   Linear.13113
21:44:50.345598  stat64                                 /Users/kunxi/Library/Application Support/Linear/sentry                               0.000048   Linear.13114
21:44:50.346311  open              F=73       (_WC_T______X___)  /Users/kunxi/Library/Application Support/Linear/sentry/scope_v3.json        0.000343   Linear.13115
21:44:50.347733  close             F=73                                                                                                      0.000299   Linear.13113
21:44:51.814743  open              F=73       (_WC_T__________)  sers/kunxi/Library/Application Support/Linear/Session Storage/000483.log    0.000575   Linear.13037
21:44:51.814824  close             F=69                                                                                                      0.000063   Linear.13037
21:44:51.816139  open              F=69       (_WC_T__________)  sers/kunxi/Library/Application Support/Linear/Session Storage/000484.ldb    0.000341   Linear.13039
21:44:51.819922  close             F=69                                                                                                      0.000026   Linear.13039
21:44:51.820041  open              F=69       (R______________)  sers/kunxi/Library/Application Support/Linear/Session Storage/000484.ldb    0.000112   Linear.13039
21:44:51.820636  open              F=74       (R______________)  /Users/kunxi/Library/Application Support/Linear/Session Storage             0.000107   Linear.13039
21:44:51.821070  close             F=74                                                                                                      0.000007   Linear.13039
21:44:51.821494  open              F=74       (R__________X___)  /Users/kunxi/Library/Application Support/Linear/Session Storage             0.000069   Linear.13039
21:44:51.821560  stat64                                 /Users/kunxi/Library/Application Support/Linear/Session Storage/MANIFEST-000001      0.000015   Linear.13039
21:44:51.821568  stat64                                 /Users/kunxi/Library/Application Support/Linear/Session Storage/LOCK                 0.000007   Linear.13039
21:44:51.821576  stat64                                 /Users/kunxi/Library/Application Support/Linear/Session Storage/000005.ldb           0.000007   Linear.13039
21:44:51.821584  stat64                                 /Users/kunxi/Library/Application Support/Linear/Session Storage/000483.log           0.000007   Linear.13039
21:44:51.821591  stat64                                 /Users/kunxi/Library/Application Support/Linear/Session Storage/000481.log           0.000007   Linear.13039
21:44:51.821600  stat64                                 /Users/kunxi/Library/Application Support/Linear/Session Storage/CURRENT              0.000007   Linear.13039
21:44:51.821604  stat64                                 /Users/kunxi/Library/Application Support/Linear/Session Storage/LOG                  0.000004   Linear.13039
21:44:51.821608  stat64                                 /Users/kunxi/Library/Application Support/Linear/Session Storage/000484.ldb           0.000004   Linear.13039
21:44:51.821614  stat64                                 /Users/kunxi/Library/Application Support/Linear/Session Storage/LOG.old              0.000006   Linear.13039
21:44:51.821621  stat64                                 /Users/kunxi/Library/Application Support/Linear/Session Storage/000482.ldb           0.000006   Linear.13039
21:44:51.821630  stat64                                 /Users/kunxi/Library/Application Support/Linear/Session Storage/000480.ldb           0.000009   Linear.13039
21:44:51.821633  close             F=74                                                                                                      0.000002   Linear.13039
21:44:51.821673  open              F=74       (R__________X___)  /Users/kunxi/Library/Application Support/Linear/Session Storage             0.000027   Linear.13039
21:44:51.821697  stat64                                 /Users/kunxi/Library/Application Support/Linear/Session Storage/MANIFEST-000001      0.000004   Linear.13039
21:44:51.821701  stat64                                 /Users/kunxi/Library/Application Support/Linear/Session Storage/LOCK                 0.000003   Linear.13039
21:44:51.821704  stat64                                 /Users/kunxi/Library/Application Support/Linear/Session Storage/000005.ldb           0.000003   Linear.13039
The IOPS can be categorized as telemetry and cache. The Linear app streamed the UI events to sentry/scope_v3.json,
then maybe batched to Sentry as telemetry.
cat /Users/kunxi/Library/Application\ Support/Linear/sentry/scope_v3.json | jq '.scope.breadcrumbs[0:3]'
[
  {
    "timestamp": 1782274519.769,
    "category": "electron",
    "message": "app.did-become-active",
    "type": "ui"
  },
  {
    "timestamp": 1782274523.165,
    "category": "electron",
    "message": "app.did-resign-active",
    "type": "ui"
  },
  {
    "timestamp": 1782275633.005,
    "category": "electron",
    "message": "app.did-become-active",
    "type": "ui"
  }
]
The timestamp field in the breadcrumbs indicates that the events were current:
date -r 1782274519
Tue Jun 23 21:15:19 PDT 2026
Linear also persists the session cache to the LevelDB, total 593 entries:
~/go/bin/ldbdump  ~/Library/Application\ Support/Linear/Session\ Storage/*.ldb | wc -l
593
It is worthy noting that I usually kept Linear open for a few weeks. The IOPS amortized over time might not be too much concerning. I closed the app, and restarted it at Jun 23 10:37 PM PST, and would keep it running for a few days, and I will report back.