Programming dojox.chart(5) - Naive scientific plotting
dojoLogarithmic axis is quite important for the scientific plotting to demonstrate
the exponential growth like infection of virus, possible a good candidate for
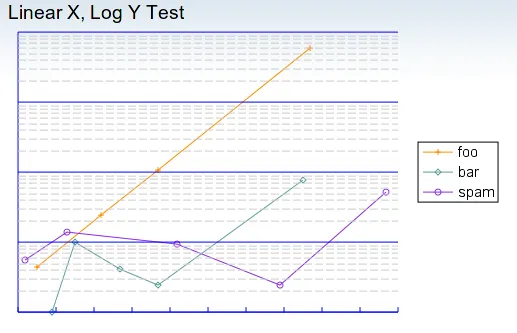
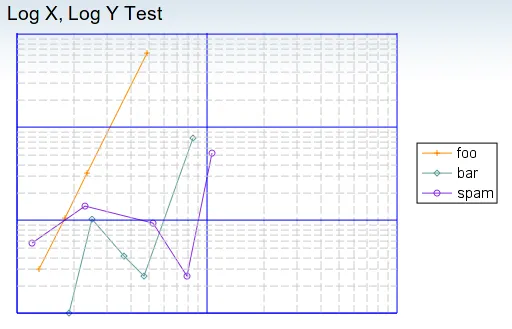
viral marketing as well. Here is two examples based upon XYLine:
XLogYLine with linear X axis and logarithmic Y axis and LogXLogYLine with
logarithmic X,Y axes. Grid is added to help readability:


Here is code snapshot.