Programming dojox.chart(4) - 2D Charts revised
dojoBasic 2D charts include the following types:
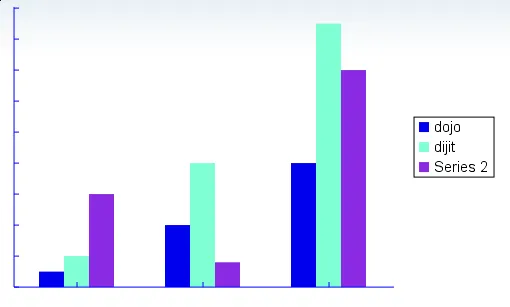
- Column, the traditional chart to show the growth of the profile
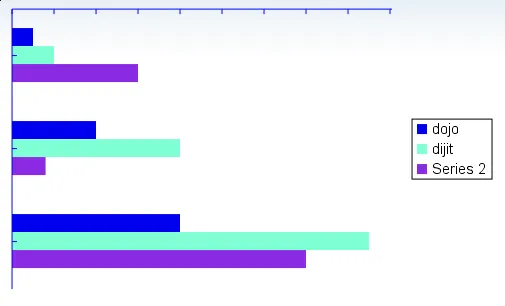
- Bar, the sister of Column
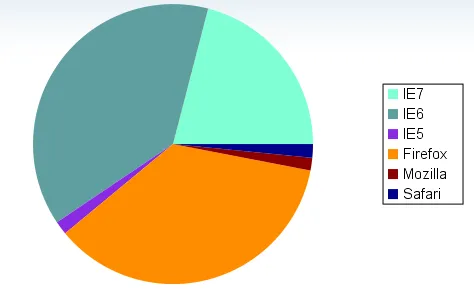
- Pie, the favorite of marketing salesman
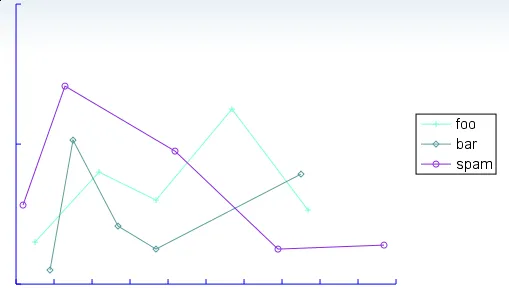
- XYLine, commonly used in scientific computing
Just as the following screenshots demonstrates:
There are quite a few variants of the basic graphics:
- Stacked Column/Bar, either normalized or not
- logarithmic axes
- 3D versions of all the above
The dojox.chart.Chart is the work horse behind the scene, there are only
couple of functions that need to be overridden to support new chart:
constructor, binding the axesgetSeriesStyle, generate the styles for series if the user do not specify_render, the ultimate method to visualize the data
The implementation depends on dojo-0.9; and we are planning to migrate the 3D chart into this framework, you may bypass the bump of the road if you stick to the dojo-svn from the very beginning.