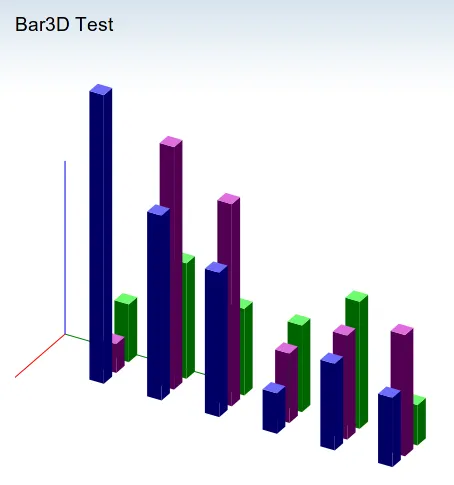
Bar3d, proudly powered by dojox.gfx3d
dojo
One picture is worthy two thousand words. The idea is inspired by the Microsoft Excel’s canonical bar3d graphics. Features include:
- Multiple-series are supported
- Lighting
- Rotation, of course you can, but you need to be aware how difficult to find the right angles.
- Animation, check calibration section
- User-interactivity, theoretically if we could figure out how to interpret the mouse movement
And there is still a long long way to go…
Z-Order
To be honest, the data series is optimized for the Z-Order rendering. The cubes are misplaced if the difference of two values are huge. This issue could be addressed by override the Z-Order of the bar.
Calibration
The best scenario for the chart users is to fill the data, let the plotter figure out the range of X, Y, Z, and the user may override the “smart ticks” if necessary. We supports the latter only. Personally I regard there is an industry standard for ticking. Just need more time to dig it.
Other missing features
Other missing features include, but not limited: grid, labels, ticks, titles and legend. Most of them are infrastructure of chart.
As always, the snapshot of code, it is
in dojox.chart namespace and depends dojox.gfx3d.