Debugging Web(4) - Swiss Army Knives
webWeb Developer Toolbar and Firebug are two must-haves for the Web developers, I will introduce another powerful debugger, venkman later.
Web Developer Toolbar
 This all-in-one toolbar gears towards getting the
Web designer out of the tedious work, such as fine-tuning CSS, troubleshooting
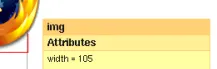
block layout, validating to the Web standards. My favorite functionality is
Display Element Information, the Ctrl-Shift-f shortcut will call a yellow box,
once the element is clicked, its attributes are shown in the yellow box, quite
nifty.
This all-in-one toolbar gears towards getting the
Web designer out of the tedious work, such as fine-tuning CSS, troubleshooting
block layout, validating to the Web standards. My favorite functionality is
Display Element Information, the Ctrl-Shift-f shortcut will call a yellow box,
once the element is clicked, its attributes are shown in the yellow box, quite
nifty.
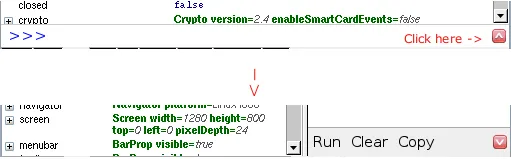
FireBug
The official website have a very detailed introduction of the FireBug. Further more, the prototype’s author demonstrates the FireBug in action here. Unlike Error Console, the FireBug expose the targeted window’s document node to the global scope, therefore, the developer can test the JavaScript code snippet in the console without hassle.
The console supports one-line command, when you click the Up button on the right, a multi-line textbox is popped out for multiply line code editing. What a considerate design!