dojo.gfx 3D support kicks off
dojodojo.gfx has aroused some buzz in the community, we are moving forward to the next step, 3D support in dojo.gfx library. Before any JavaScript coding, I would like to develop some utilities for verification and visualization.
The most convenient tool for 3D plotting in my humble opinion is gnuplot; it is free, and available in Linux, Windows and Mac OSX. Here is a simple example to plot the cube from (0, 0, 0) to (1,1,1):
#gnuplot
gnuplot> set view 60, 30
gnuplot> splot "cube.plt" using 1:2:3 with lines
The default output is X11, you can even rotate the world coordination by using mouse to take a different view. And you may generate the PNG output for printing by setting up the terminal to png:
#gnuplot
gnuplot> set terminal png
gnuplot> set output "cube.png"
gnuplot> splot "cube" using 1:2:3 with lines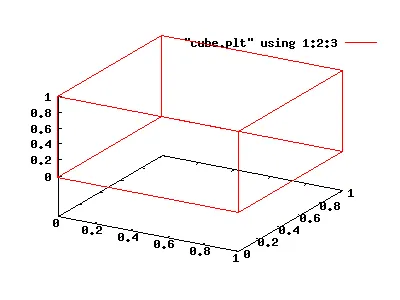
The cube data file is organized in blocks, separated by two blank lines. Each block contains one closed polygon.
The best companion for GNUPlot is Octave. However, the plot interface in Octave is less versatile than manipulating the GNUPlot directly, and it is quite tedious to operate file using Octave, so I decided to use my favorite, python to do this job.
transform.py would read the (x,y,z) from the stdin, and write the transformation output to stdout. Both input and output are compatible with GNUPlot, so we can render cube2d.plt in X-Y coordination.
./transform.py -c 0 0 0 60 0 30 cube2d.pltand then in gnuplot:
gnuplot> plot "cube2d.plt" using 1:2 with linesSince the transform.py uses isometric projection, while the GNUPlot uses
perspective projection, the output is a little different, but this is sufficient
for our next step.